Dashboard widgets
NAVIGATION Modules > Dashboards > Manage > Create Dashboard > Widgets > Add Widget
PERMISSIONS Administrator
Dashboards display data widgets, which are graphical interface elements that visualize and summarize information about the data in VSA 10. In some cases, clicking a graphical element opens the details of the underlying data. Clicking the Back arrow ![]() returns you to the main display for the widget. Or, you can click an individual record to open that record.
returns you to the main display for the widget. Or, you can click an individual record to open that record.
IMPORTANT On the Widgets configuration page, individual widgets cannot be saved if the Details configuration page is incomplete. Refer to Dashboard details and Configuration page indicators.
Widget types
Refer to Data Sourceto learn how to filter the data for each widget in Widget settings.
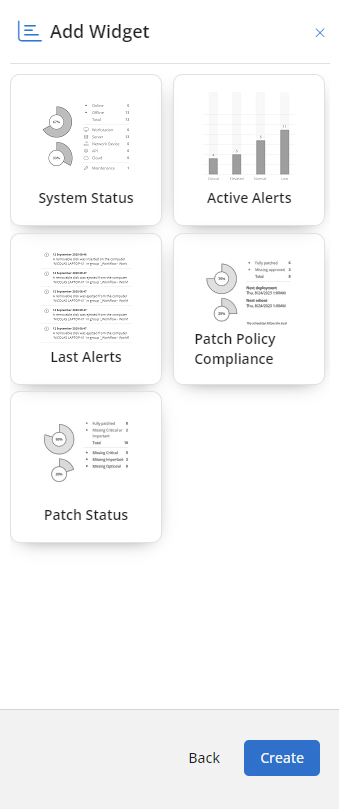
The following widget types are currently available from the widget library:
| Name | Type | Description |
|---|---|---|
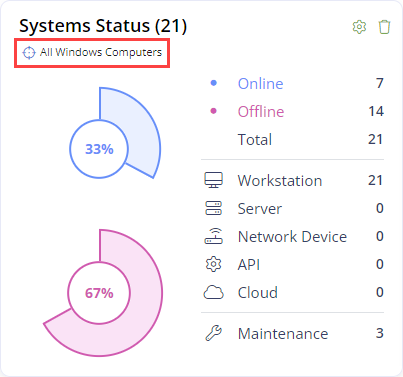
System Status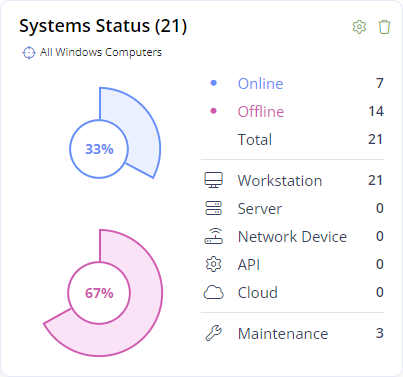 |
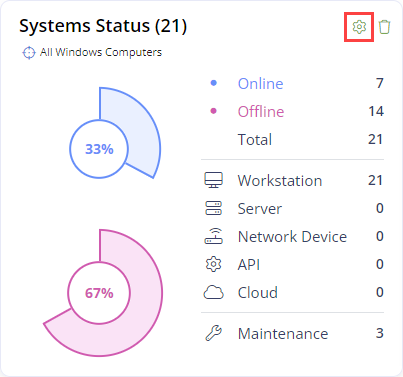
Radial progress bars | Displays the number of systems applicable to the selected data source that meets the following criteria:
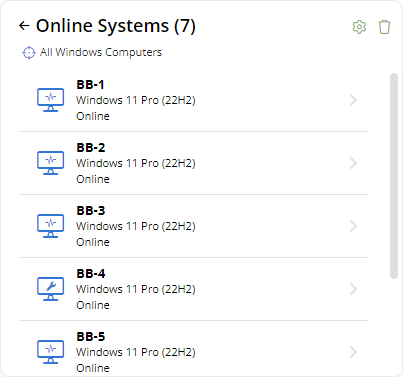
If at least one device meets any of those criterion, you can drill into the results set for that criterion. Click the criterion via the radial progress bar or the criteria list to open a list of the devices, which you can scroll through within the widget. Click a system to navigate away from the dashboard or Widgets configuration page and open the detail page for the system within Systems > All Systems. Refer to Device details pane. |
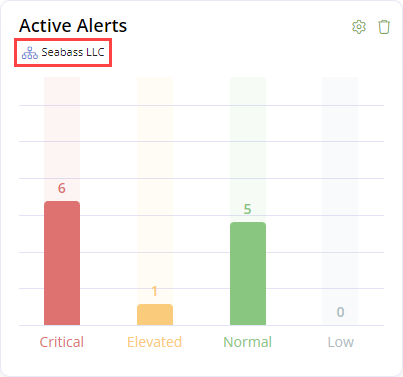
Active Alerts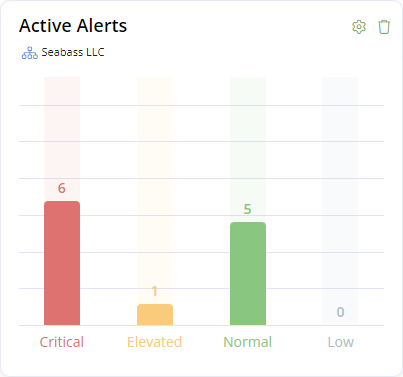 |
Bar chart | Shows the number of active device alerts that apply to the selected data source, broken down by the following alert statuses: Critical, Elevated, Normal, and Low. If at least one alert of a certain status exists, you can drill into the results set for that alert status. Click the bar to open a list of the alerts, which you can scroll through within the widget. NOTE Each bar shows the total number of alerts. The list displays up to 50 of those alerts from least recent to most recent. Click an alert to open the full description within the widget. For more information about device alerts, refer to Device notifications and Viewing and exporting system alert notifications. |
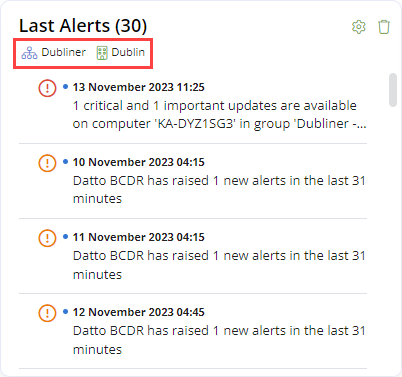
Last Alerts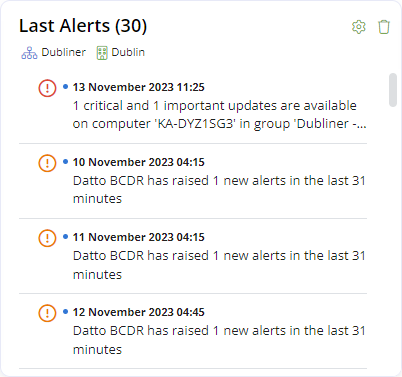 |
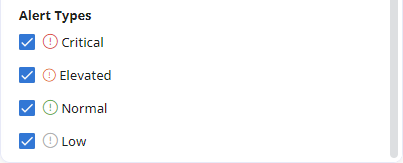
List | Shows a list of the latest alerts that apply to the selected data source, from least recent to most recent. The number and statuses of the alerts listed depend on the selected widget settings. Refer to Max Alert Count and Alert Types in Widget type-specific settings. The colors of the icons depict the alert statuses, as follows: Alerts are listed in the order of the statuses in the preceding list (from critical to low), which may limit the visibility of certain statuses in the list. EXAMPLE If the Max Alert Count is set to 30 and all statuses are selected in Alert Types, but more than 30 of the latest alerts are critical, the list will display only the 30 latest critical alerts and no alerts of other statuses. Click an alert to open the full description within the widget. For more information about device alerts, refer to Device notifications and Viewing and exporting system alert notifications. |
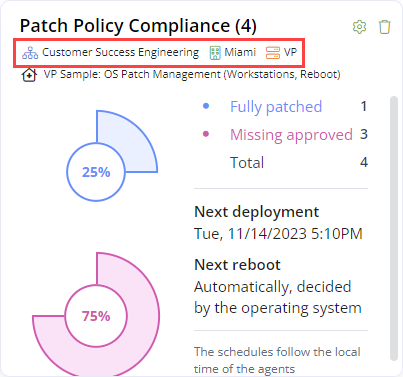
Patch Policy Compliance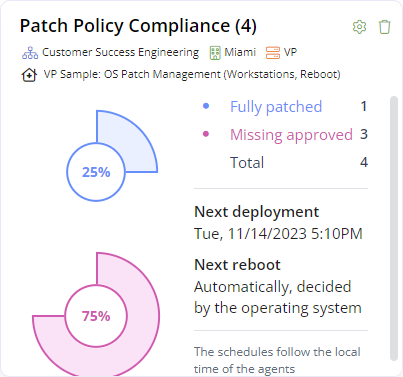 |
Radial progress bars | This widget is filtered by a specific patch policy configured in the widget settings. Refer to Select Patch Policy in Widget type-specific settings. Displays the number of devices applicable to the selected data source and patch policy that meets the following criteria:
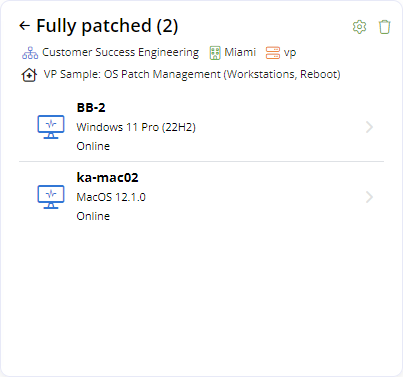
If at least one device meets any of those criterion, you can drill into the results set for that criterion. Click the criterion via the radial progress bar or the criteria list to open a list of the devices, which you can scroll through within the widget. Click a system to navigate away from the dashboard or Widgets configuration page and open the detail page for the system within Systems > All Systems. Refer to Device details pane. |
Patch Status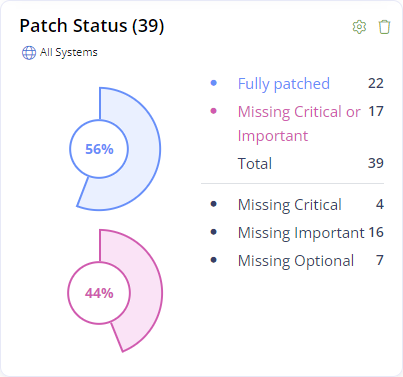 |
Radial progress bars | Displays the number of devices applicable to the selected data source that meets the following criteria:
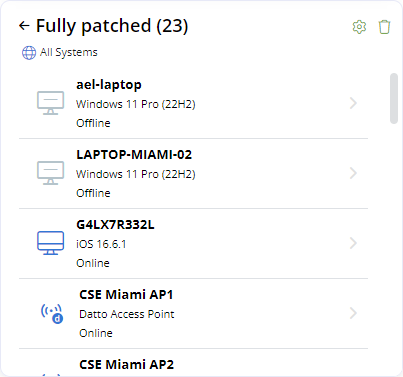
If at least one device meets any of those criterion, you can drill into the results set for that criterion. Click the criterion via the radial progress bar or the criteria list to open a list of the devices, which you can scroll through within the widget. Click a system to navigate away from the dashboard or Widgets configuration page and open the detail page for the system within Systems > All Systems. Refer to Device details pane. |
Widget settings
After selecting a widget type, the widget settings will open automatically for configuration. Cancel or save your changes using the icons in the upper-right corner of the widget settings ![]() . After initially saving, you can edit the settings any time by clicking the Settings icon
. After initially saving, you can edit the settings any time by clicking the Settings icon ![]() .
.
If the saved settings do not contain any data, the widget displays No systems available. Widgets with or without data appear in the saved dashboard. Refer to Viewing dashboards.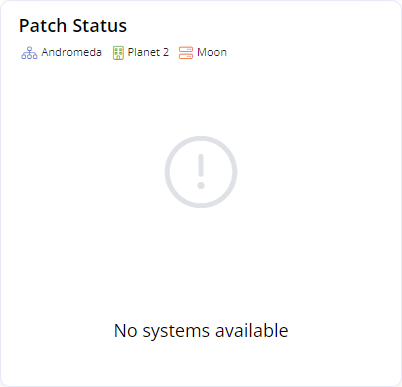
The following fields are available in the widget settings:
| Field | Required? | Description |
|---|---|---|
| Widget Name |
|
By default, this field is pre-filled with the name of the widget type. If desired, replace it with a custom name for the widget. |
| Data Source |
|
Selecting the data source creates a filter for the widget data, allowing you to constrain the result sets as much or as little as desired. From the drop-down menu, select one of the following data sources:
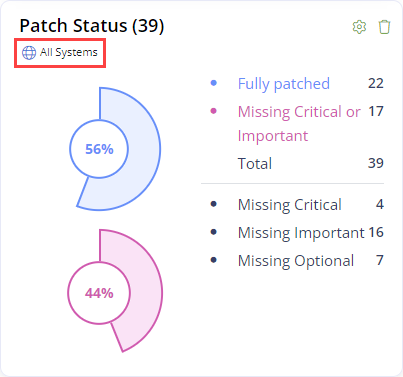
EXAMPLE The example System Status widget shown in the Widget types section in this topic is configured with Scope as the data source. EXAMPLE The example Active Alerts widget shown in the Widget types section in this topic is configured with Organization as the data source. EXAMPLE The example Last Alerts widget shown in the Widget types section in this topic is configured with Site as the data source. EXAMPLE The example Patch Policy Compliance widget shown in the Widget types section in this topic is configured with Agent Group as the data source. EXAMPLE The example Patch Status widget shown in the Widget types section in this topic is configured with All Systems as the data source. |
| Select Scope NOTE This field appears for selection only if you select Scope as the data source. |
|
Refer to the Scope description for Data Source. Select one scope from the drop-down menu. |
| Select Organization NOTE This field appears for selection only if you select one of the following data sources: Organization, Site, or Agent Group. |
|
Refer to the Organization description for Data Source. Select one organization from the drop-down menu. |
| Select Site
NOTE This field appears for selection only if you select one of the following data sources: Site or Agent Group. |
|
Refer to the Site description for Data Source. Select one site from the drop-down menu. If no sites exist in the selected organization, the drop-down menu displays No Sites. You must add a site to the organization or select a different data source configuration to save the widget settings. Refer to Creating sites. |
| Select Agent Group NOTE This field appears for selection only if you select Agent Group as the data source. |
|
Refer to the Agent Group description for Data Source. Select one agent group from the drop-down menu. If no agent groups exist in the selected site, the drop-down menu displays No Agent Groups. You must add an agent group to the site or select a different data source configuration to save the widget settings. Refer to Creating agent groups. |
Widget type-specific settings
How to...
You can add widgets to dashboards when creating or editing dashboards via Dashboards > Manage. You must first configure the dashboard details. For full instructions, refer to Create a dashboard and Edit a dashboard.
You can remove widgets from dashboards when creating or editing dashboards via Dashboards > Manage. Refer to Creating and editing dashboards. Complete the following steps to remove a widget:
On the Widgets configuration page, click the Remove Widget icon ![]() in the upper-right corner of the widget box. The widget will be immediately deleted.
in the upper-right corner of the widget box. The widget will be immediately deleted.
NOTE Removing a widget will not alter the placement of any remaining widgets. Therefore, the dashboard will display a gap where that widget once existed (if in between other widgets). You may wish to add a new widget to that placeholder or rearrange the remaining widgets.
