Dashboards
NAVIGATION Modules > Dashboards > View
NAVIGATION Modules > Dashboards > Manage
PERMISSIONS Administrators can view all dashboards. Users who belong to non-administrative teams that have been manually granted access to certain dashboards can view those dashboards via Dashboards > View.
PERMISSIONS Only administrators can access Dashboards > Manage.
Dashboards display the information in your database in a graphical format, allowing you to visualize and monitor the health of your estate at a glance. The customizable widgets available to add to dashboards allow you to showcase and analyze various categories of curated data.
Users with the adequate permissions can create, view, and edit dashboards from the Dashboards menu at the top of the left navigation menu.
To learn how to create or edit dashboards and populate dashboards with widgets, refer to Creating and editing dashboards and Dashboard widgets.
Viewing dashboards
For users who have access to the default dashboard in the account, navigating to Dashboards > View opens the default dashboard.
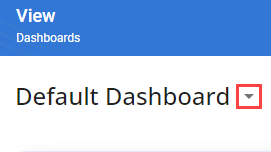
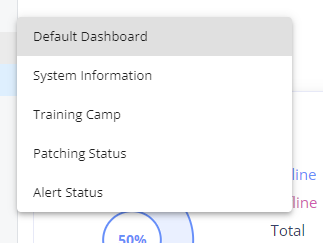
Click the drop-down arrow next to the current dashboard name to open a menu of the dashboards you have access to. To open a different dashboard, select any dashboard from the menu.

NOTE If you wish to change the placement of widgets in a dashboard, you can do so on the Widgets configuration page when creating or editing a dashboard. Refer toCreating and editing dashboards.
In the upper-right corner of the dashboard, click the Full Screen icon ![]() to open the dashboard in full-screen mode, which hides the left navigation menu and activates dashboard cycling functionality in the upper-right corner of the page.
to open the dashboard in full-screen mode, which hides the left navigation menu and activates dashboard cycling functionality in the upper-right corner of the page.
Dashboard cycling

Initiate automatic dashboard cycling by clicking the Play icon ![]() in full-screen mode. The current dashboard will be on display for the next 30 seconds, which you can track by watching the time progress bar.
in full-screen mode. The current dashboard will be on display for the next 30 seconds, which you can track by watching the time progress bar. ![]()
After 30 seconds, the next dashboard in the cycle opens automatically. To stop dashboard cycling, click the Stop icon ![]() . To manually proceed to the previous or next dashboard in the cycle, click the Previous icon
. To manually proceed to the previous or next dashboard in the cycle, click the Previous icon ![]() or Next icon
or Next icon ![]() , respectively. To open a specific dashboard, click the drop-down arrow next to the current dashboard name to open a menu of the dashboards you have access to, then select any dashboard from the menu.
, respectively. To open a specific dashboard, click the drop-down arrow next to the current dashboard name to open a menu of the dashboards you have access to, then select any dashboard from the menu.
To exit full-screen mode, click the Exit Full Screen icon ![]() in the upper-right corner of the page or press the Esc key on your keyboard.
in the upper-right corner of the page or press the Esc key on your keyboard.
List of dashboards
Administrators can navigate to Dashboards > Manage to view a list of dashboards in the account.
The list displays the following information:
| Field | Description |
|---|---|
| Name | The name of the dashboard. Refer to Name in Dashboard details. |
| Team | The team or teams that have been granted access to the dashboard. Refer to Team Access Level in Dashboard details. |
| Default Dashboard | Indicates whether or not the dashboard is set as the default dashboard in the account, as follows:
NOTE Only one dashboard can be set as the default dashboard in the account, but an administrator can change the default at any time.
Refer to Default Dashboard in Dashboard details. |
| Last Modified Date | The date and time when a user last updated the dashboard, displayed according to the time zone set in your browser. |
Analyzing data in dashboard widgets
Refer to Dashboard widgets.


