Viewing details of active connectors
NAVIGATION Modules > Devices > Active Connectors
PERMISSIONS Connectors > Read-only access to all Connectors pages
PERMISSIONS Connectors > Full access to all Connectors pages
The Active Connectors page provides a single location from which you can audit all of the virtualization servers you've connected to your VSA 10 environment. From this page, you can see the runtime state of each hypervisor's virtual hosts, detect unhealthy instances, review events, and retrieve detailed information about each endpoint.
This article describes the page's layout and functions.Overview
From the left navigation menu in VSA 10, navigate to Devices > Active Connectors.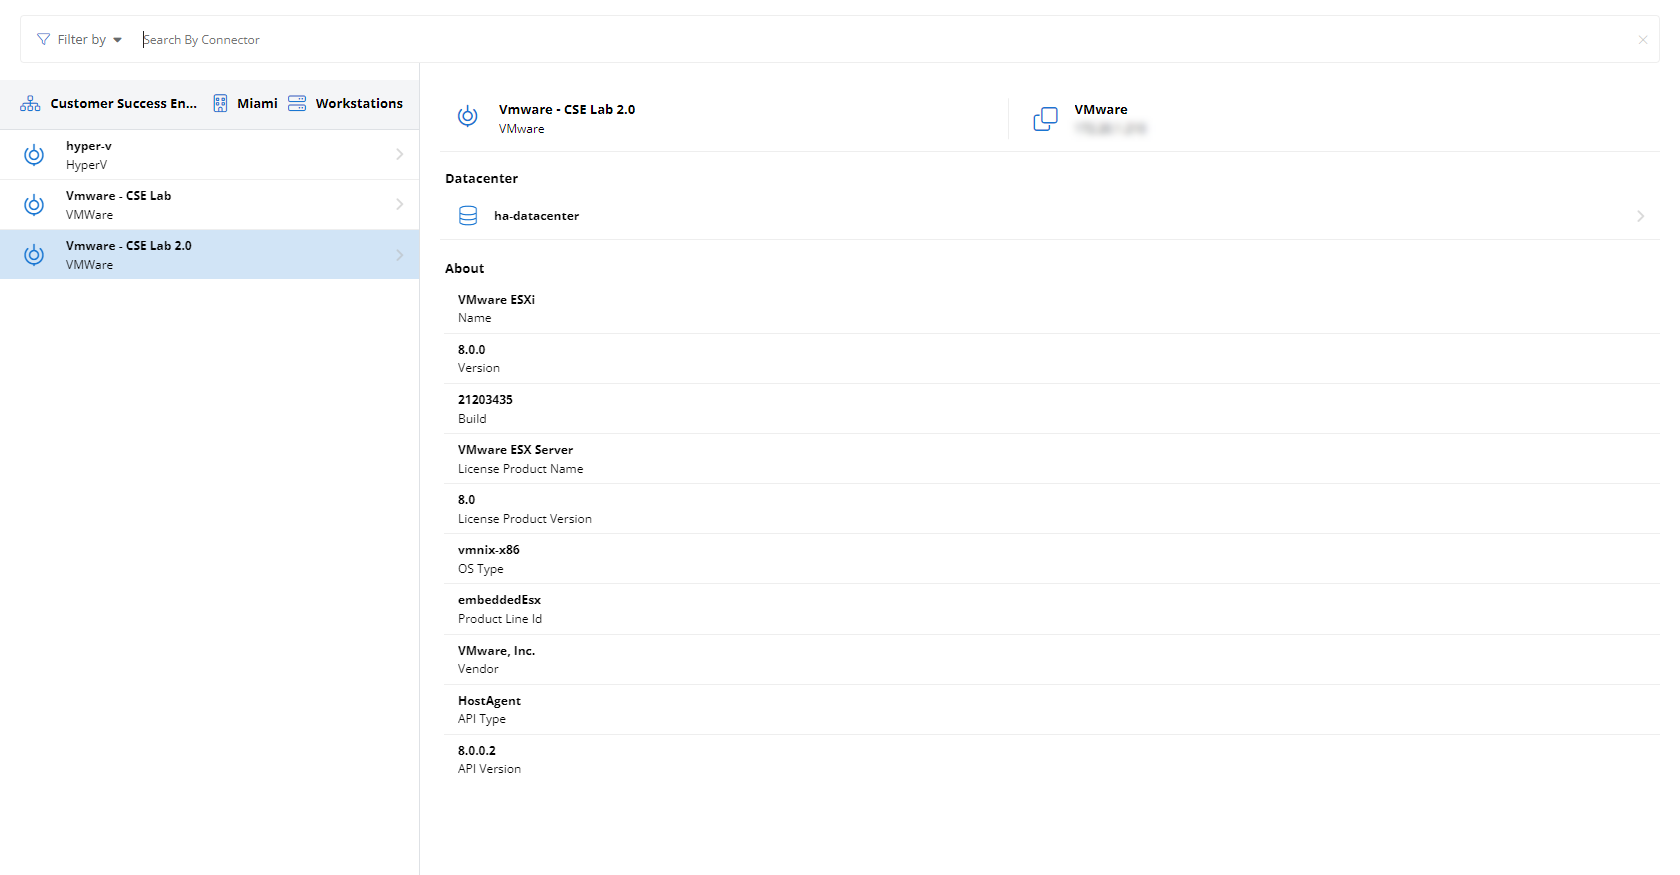
As you navigate, you'll see the following features and fields:
| Feature | Definition | ||||||||||
|---|---|---|---|---|---|---|---|---|---|---|---|
| Search field | Enter a partial or whole value to filter current view to matching records | ||||||||||
| Filter by | Click to select additional criteria by which you can refine your search, including by type, group, and probe | ||||||||||
| Connector list | Enumerates all connectors that match the current selections in the Search By Connector field, sorted and grouped by organization; the information appearing in the list is as follows:
Click any connector to view details of the associated hypervisor and its hosts. Refer to Hypervisor details pane for more information. |
Clicking any connector will cause VSA 10 will attempt to open a socket to the target hypervisor and send a virtual machine introspection (VMI) request. Once the connection is established, the following information will appear in the details pane.
IMPORTANT If the hypervisor is unreachable, you'll instead see the error message, "Probe 'hostname' is offline."
Header
| Icon | Definition |
|---|---|
Connector name and hypervisor brand | |
Hypervisor brand and IP address |
Detail fields
| Field name | Definition |
|---|---|
| Datacenter | Name of the data center where the hypervisor is hosted; click to pivot to the Datacenter details pane |
| About | Information about the hypervisor, including its platform virtualization name, version, and build, license information, and additional extended attributes |
In the data center details view, you have access to basic information about the selected hosting environment's hypervisor configuration and recent events.
Header
| Icon | Definition |
|---|---|
Connector name and hypervisor brand | |
Data center name |
Details
| Field name | Definition |
|---|---|
| Clusters | If hypervisor clusters exist in the hosting environment, they will appear here |
| Hosts | The fully-qualified domain names (FQDNs) and online status of all physical hosts in the selected environment; click any host name to pivot to the Host details pane |
| Status | Click Events to view a journal of data center events, such as outages and other service disruptions |
Status
| Field name | Definition |
|---|---|
| Events | Click Events to view a journal of virtual machine events logged for the guest |
The host details view provides detailed information about the selected physical host, including hardware information, operational status, and the virtual guests residing within the hypervisor.
Header
| Icon | Definition |
|---|---|
Connector name and hypervisor brand | |
Fully-qualified domain name (FQDN) of the selected host |
Details
| Field name | Definition |
|---|---|
| State | Indicates whether the device is powered on or off |
| Uptime | Time elapsed, in days, hours, and minutes, since the device's last startup event |
| Connection State | The hypervisor's network connection status |
| Maintenance Mode | Reports whether or not the host is in maintenance mode for service; you cannot power on virtual machines or migrate virtual machines to a host in maintenance mode |
| CPU | Number and type of processors installed in the hypervisor |
| Memory | Total amount of RAM available to the device |
| Vendor | Manufacturer of the hypervisor |
| Model | Model of the hypervisor |
Virtual Machines
The Virtual Machine enumerates all guests associated with the hypervisor and their online status, sorted by FQDN. Click any guest's name to view its detail pane. Refer to Virtual machine details pane.
| Icon | Definition |
|---|---|
Virtual machine is powered on | |
Virtual machine is powered off |
The details pane enables you to review attributes of a selected device and take basic management actions. The following information and management options are available from this location.
Header
| Icon | Definition |
|---|---|
Connector name and hypervisor brand | |
Fully-qualified domain name (FQDN) of the selected guest |
Details
| Field name | Definition |
|---|---|
| State | Indicates whether the device is powered on or off |
| Heartbeat | Reports the status of communication between the virtual guest and virtual host; if a status other than OK is reported, the guest may have become unresponsive |
| Uptime | Time elapsed, in days, hours, and minutes, since the device's last startup event |
| Guest Operating System | Type and version of the operating system installed on the guest |
| Memory | Total amount of RAM available to the device |
| Tools | Indicates whether the guest's management tools are running and up-to-date |
| IP Address | Last reported IP address of the guest |
| DNS | The guest's configured Domain Name System (DNS) server |
| CPU Usage | Percentage of allocated CPU resources in use by the guest |
| Host Memory Usage | Total RAM on the host in use to virtualize this guest |
| Guest Memory Usage | Total allocated RAM in use by the guest |
Status
| Field name | Definition |
|---|---|
| Snapshots | View all point-in-time copies of the virtual guest that exist on the host |
| Events | Click Events to view a journal of virtual machine events logged for the guest |


