Table report element
NAVIGATION
Modules > Advanced Reporting > Create icon ![]() > Create Report > select report type > Create > Table
> Create Report > select report type > Create > Table
NAVIGATION
Modules > Advanced Reporting > Categories icon ![]() > click a row > Edit > Table
> click a row > Edit > Table
PERMISSIONS Advanced Reporting > View Reporting and run reports

The Table element is the most commonly used data region in designing reports. It organizes the data in a tabular format, that is, in rows and columns which makes the data easier to understand.
By default, a table has three columns and three rows, a total of nine cells, where each cell is filled with a text box. In a table, you can sort and filter the bound data, display a total row at the end of a table, merge rows and columns, freeze to keep certain rows and columns visible when scrolling the table, and more.
A table is composed of the following components:
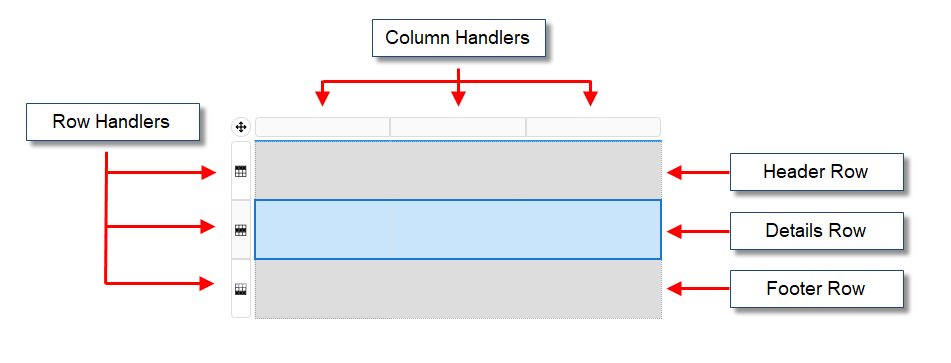
- Header Row: By default, a table has a header row that appears at the top of the table. It is typically used to label each column or add a header to the table. A table can have several header rows.
- Details Row: Repeats for each record in the bound dataset. If the details row is inside the row group, it will repeat once for each unique value of the group. A table can have more than one details row. Note that the details group is the innermost child group.
- Footer Row: By default, a table has a footer row that appears at the end of the table. You could use the footer rows to display grand totals or notes. A table can have several footer rows.
- Row and Column Handlers: Use to add rows and columns to the table. Note that the added row can be a header row, details row, or footer row.
There are three ways that you can bind data to a table:
Click and drag items from the Data Binding tab on the right. The header row in the table will automatically fill with the corresponding labels.
Click into a text box in the details row, and use the context menu that pops up to select a field.
From the Data Binding tab on the right, click Select Fields next to the dataset and choose one or more desired fields. Then, drag and drop them into the design area. This method will create the table for you out of the selected data fields. 
Once you create a table in the report designer, you can insert and delete additional rows and columns in your table based on your requirements.
Method 1
- Select the cell in the row (or the entire row) where you want to add a row.
- Right-click the selected cell (or row), and choose one of the following insert options from the context menu:
- To add a new row above the selected row, choose the Row > Insert Row - Above option.
- To add a new row below the selected row, choose the Row > Insert Row - Below option.
Method 2
- Click anywhere inside the table.
- A row handler will appear when you place the cursor to the left of the table row. Click the row handler to add a new row.
Method 3
- Select the cell in the row (or the entire row) where you want to add a row.
- Right-click the selected cell (or row), and choose the Row > More option from the context menu.
- In the Insert Rows dialog box that appears, specify the number of rows you want to insert and their position (that is, above or below) with respect to the selected cell (or row) in the table. The Count field in the dialog accepts values ranging from 1 to 20.
Method 1
- Select the cell in the column (or the entire column) where you want to add a column.
- Right-click the selected cell (or column), and choose one of the following insert options from the context menu:
- To add a new column to the left of the selected column, choose the Column > Insert Column - Left option.
- To add a new column to the right of the selected column, choose the Column > Insert Column - Right option.
Method 2
- Click anywhere inside the table.
- A column handler will appear when you place the cursor on the top of the table column. Click the column handler to add a new column.
Method 3
- Select the cell in the column (or the entire column) where you want to add a column.
- Right-click the selected cell (or column), and choose the Column > More option from the context menu.
- In the Insert Columns dialog box that appears, specify the number of columns you want to insert and their position (that is, left or right) with respect to the selected cell (or column) in the table. The Count field in the dialog accepts values ranging from 1 to 20.
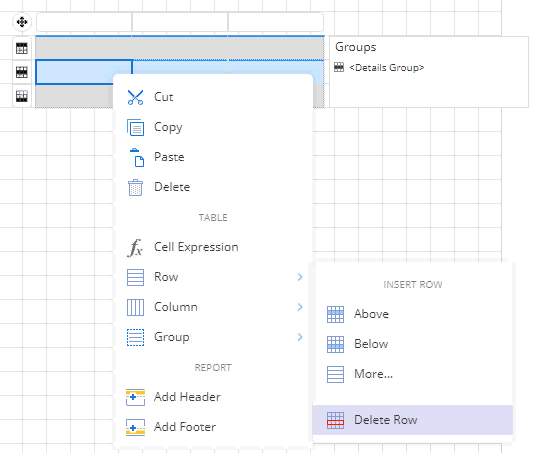
Deleting rows from a table
- Select the cell in the row (or the entire row) which you want to delete.
- Right-click the selected cell (or row), and choose the Row > Delete Row option from the context menu.
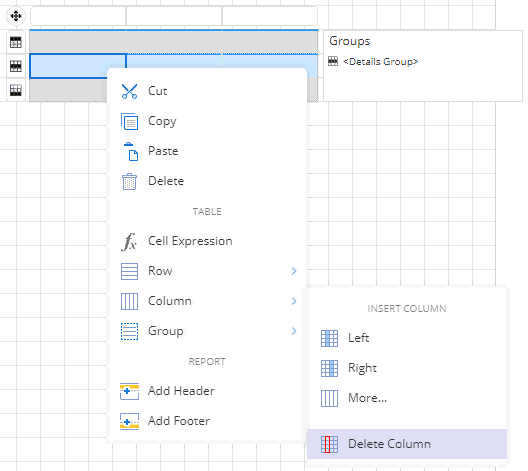
Deleting columns from a table
- Select the cell in the column (or the entire column) which you want to delete.
- Right-click the selected cell (or column), and choose the Column > Delete Column option from the context menu.
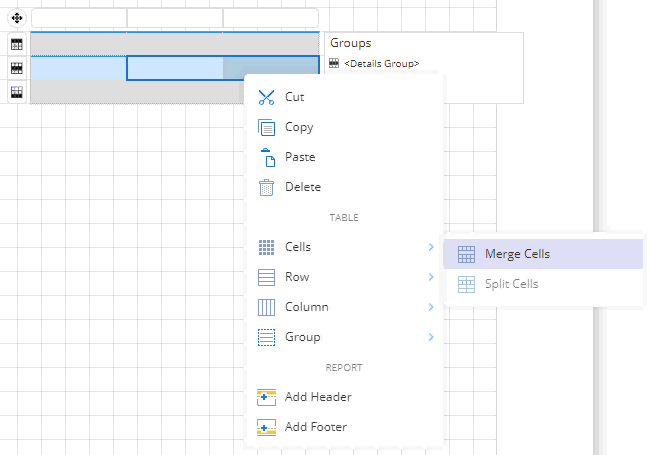
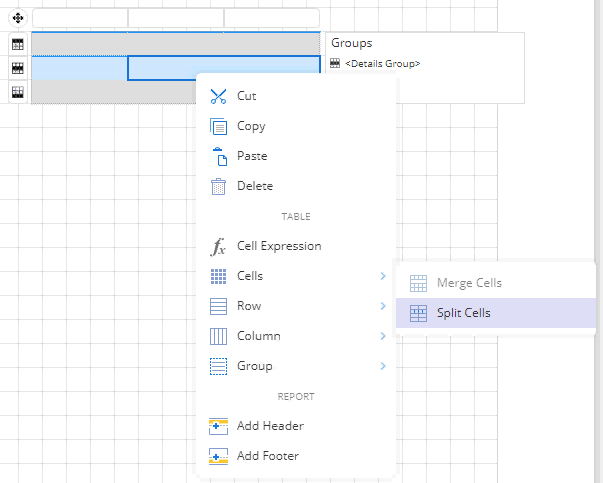
Merging cells in a table data region
- Select the cells you want to combine. Use the Ctrl key to select more than one cell.
- Right-click the selected cells, and choose the Cells > Merge Cells option from the context menu.
Splitting cells in a table data region
- Select the cell you want to split.
- Right-click the selected cell, and choose the Cells > Split Cells option from the context menu.
Grouping is used to combine the rows based on certain values in one or more columns. If you group the data based on one column, all the rows with the same column values are grouped into one section. Adding groups to a table makes it easier to summarize and analyze the complex data in reports.
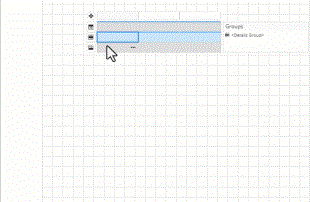
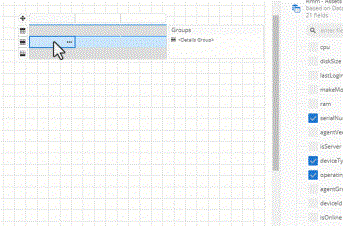
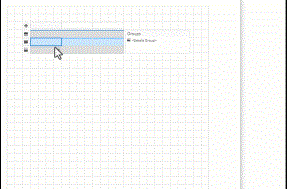
Adding a group to a table data region
- Click anywhere inside the table to make the Groups pane appear on the right side of the table.
- Drag and drop the desired field from the Data tab to the Groups pane. This adds a Group Header and Footer above and below the details row as shown and sets the Grouping Expression property to in the Properties pane.
Alternately, you can add a group by selecting the Group > Insert Group option from the context menu. - Merge the cells in the Group Header row by selecting the Cells > Merge Cells option from the context menu and enter the following expression in the Value property as "PolicyType =".
For more information, see Merging cells. - In the Group Footer row, select the cell falling in the column and enter the below expression in its Value property as
{Sum("DataFieldName")}. This will add a summarized value for the total at the end of each section. - Similarly, select the cell falling in the column and enter the below expression in its Value property as
{Sum("DataFieldName")}.This will add a summarized value for the total at the end of each section. - Additionally, you can enter the text Sub Total in the Group Footer cell of the Region column.
In an RDL report, when a user previews a table data region containing a large amount of data in Galley mode, they must scroll to see all of the data. However, on scrolling the rows or columns out of sight, the data becomes difficult to understand.
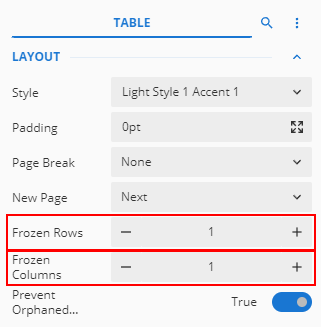
To overcome this problem, you can freeze the row(s) and column(s) so that they remain visible while the rest of the table scrolls.
Steps
- Select the entire table and go to the Properties pane on the right.
- Scroll down the panel and find the Frozen Rows and Frozen Columns properties.
- Use the Frozen Rows property to specify the numbers of row(s) you want to freeze in the table. Note that this property is applicable only to the header row(s), which means you should not exceed the row count than the actual number of header row(s) in the table.
- Use the Frozen Columns property to specify the number of column(s) you want to freeze in the table.
Sorting is the most commonly used operation for data analysis. Users can sort the data by one or more columns, alphabetically or numerically, in ascending or descending order. Sorting helps users to organize, better understand, and quickly visualize the data in a table.
Applying sort to a table
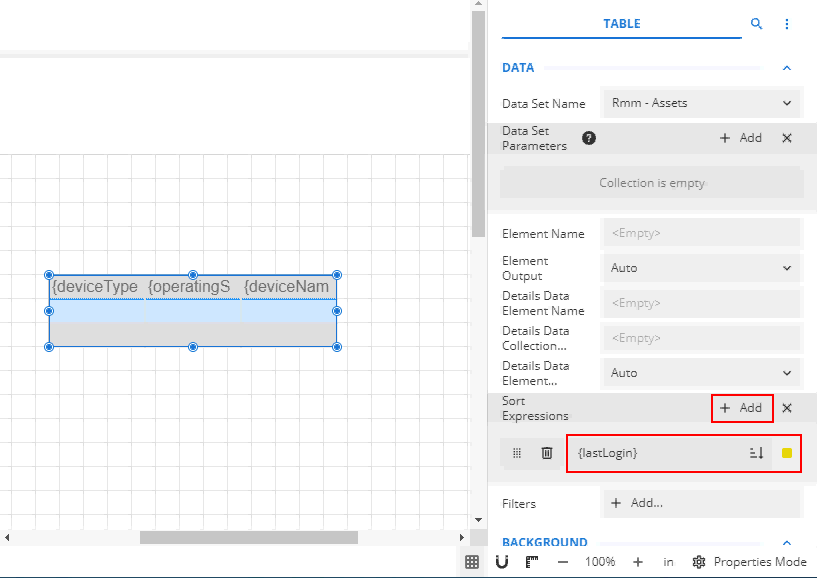
- Select the table and go to the Properties pane on the right.
- Under the Data section, find the Sort Expressions property. This property contains the name of the field or an expression based on which you want to sort the data.
- Click Add Item and choose the desired field from the Data Binding drop-down. The drop-down lists all the available fields in the bound dataset. You can also add expressions.
- Choose whether to sort the data in ascending or descending order through the Sort option. The default order is ascending.
Applying sort to a group
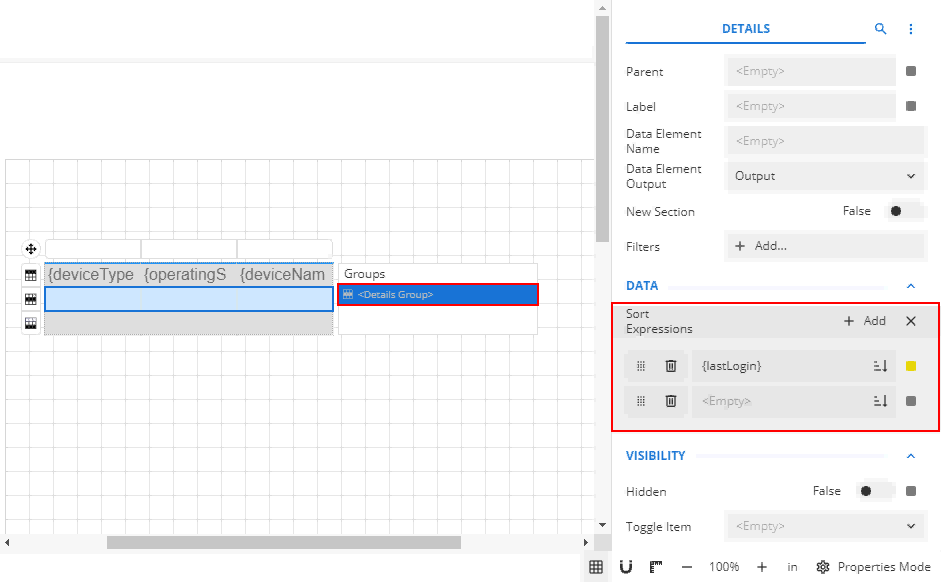
- From the Groups pane, select the details group. Applying sort to the details group helps in organizing the data within the groups.
- Under the Data section, find the Sort Expressions property. This property contains the name of the field or an expression based on which you want to sort the data.
- Click the Add Item button and choose the desired field from the Data Binding drop-down. The drop-down lists all the available fields in the bound dataset. You can also add expressions.
- Choose whether to sort the data in ascending or descending order through the Sort button. The default order is ascending.
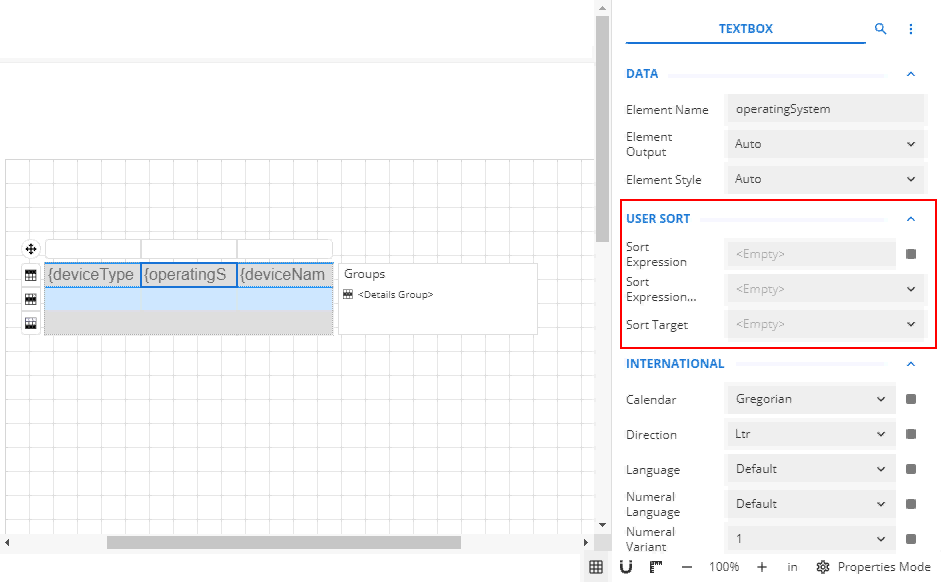
Applying interactive sort to a table
- Select the column header cell according to which you want to sort the data.
- Go to the Properties pane on the right, and in the User Sort section, find the Sort Expression property. This property contains the name of the field or an expression based on which you want to sort the data.
- Choose the desired field from the Data Binding drop-down. The drop-down lists all the available fields in the bound dataset. You can also add expressions.
- Specify the scope to which you want to apply the sort in the Sort Expression Scope property. The only possible value for this property is the currently selected table name.
- Choose whether to set the Sort Target property to the dataset or table.
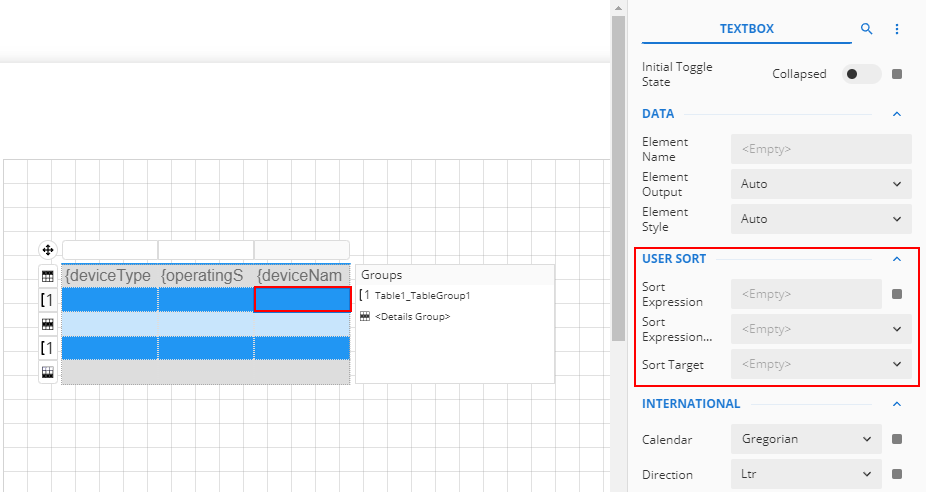
Applying interactive sort to a group
- Select the group header cell where you want to add the interactive sort buttons.
- Go to the Properties pane and find the Sort Expression property under the User Sort section. This property contains the name of the field or an expression based on which you want to sort the data.
- Choose the desired field from the Data Binding drop-down. The drop-down lists all the available fields in the bound dataset. You can also add expressions.
- Specify the scope to which you want to apply the sort in the Sort Expression Scope property. The possible values are the currently selected table name and its associated group(s). Set the Sort Expression Scope property to the desired group name.
- Choose whether to set the Sort Target property to dataset, table, or group.
Use filters to view only the data in which you are interested. The filters make the data analysis easy and let you focus on the specific information.
Steps
Following are the steps to filter data in a table. Use the AND or OR operators to add multiple filters to a table.
- Select the table by clicking the four-way arrow in the upper left. If applying a filter on a group, instead select the required group from the Groups pane.
- Go to the Properties panel and find the Filters property under the Data section. If applying a filter on a group, you can find the Filters property under the Group section.
- Click the Add button to define the filter criteria for the table.
- The first filter criteria will be applied to the selected column. Therefore, click Add and select the target field from the drop-down.
- Set the Operator to Equal To (=) and Value to your required value.
- Add additional filters as needed, using AND or OR operators to create the proper filter.
EXAMPLE This filter configuration would show all devices that have an OS like Windows and are a server (that is, Windows servers).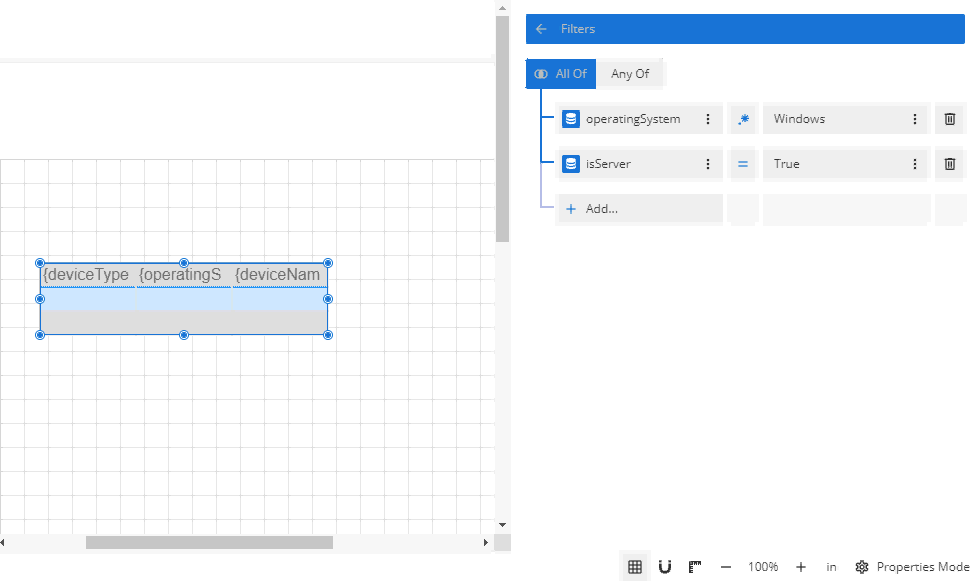
Manually numbering the rows in a table is a time-consuming task. Use the RowNumber function of the Expression Editor to automatically generate the sequence number for each new row in the table. You can also apply this function on grouped data to find the running count of all the rows in the specified scope.
Steps
- Add a new column to the table using the column handle or the context menu. This column will contain the row numbers.
- Enter the text RNo in the header cell of the new column.
- Right-click the detail cell of the new column and choose the Cell Expression option from the context menu. Alternately, you can set the Value property in the Properties panel to Expression.
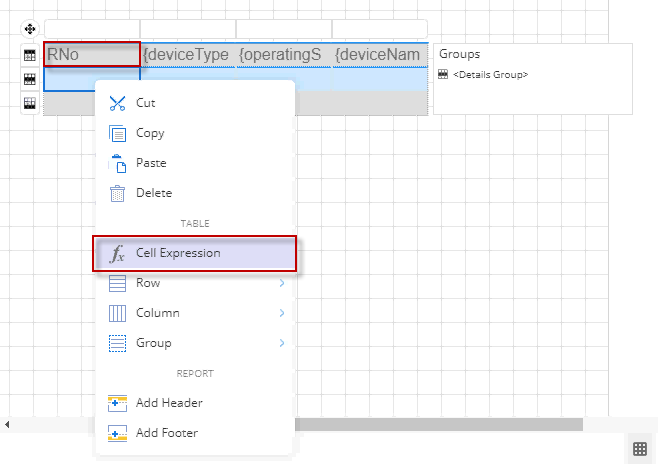
- In the Expression Editor, double-click the RowNumber property under Common Functions > Miscellaneous on the left.
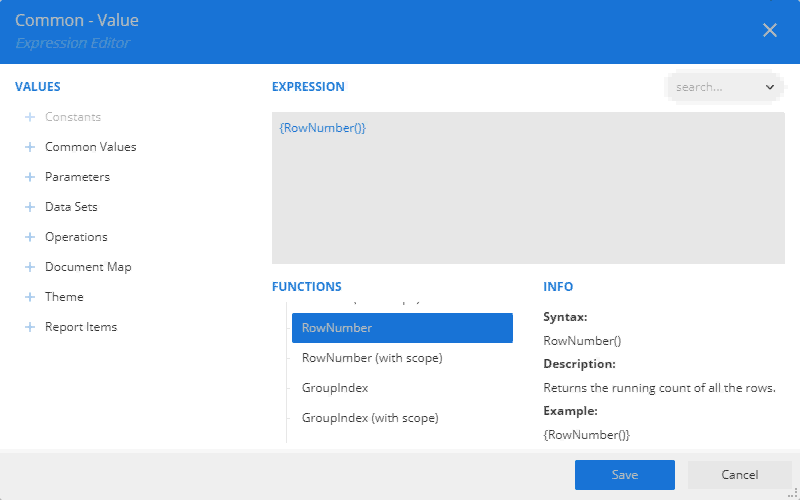
- Click Save and preview the report.
Showing numbers with scope in a table data region
- Add a new column to the table using the column handle or the context menu. This column will contain the row numbers for the group.
- Enter the text Group RNo in the header cell of the new column.
- In the Group pane on the right of the table, select the row group name.
- Copy the name of the group name from the Value property of the Properties panel.
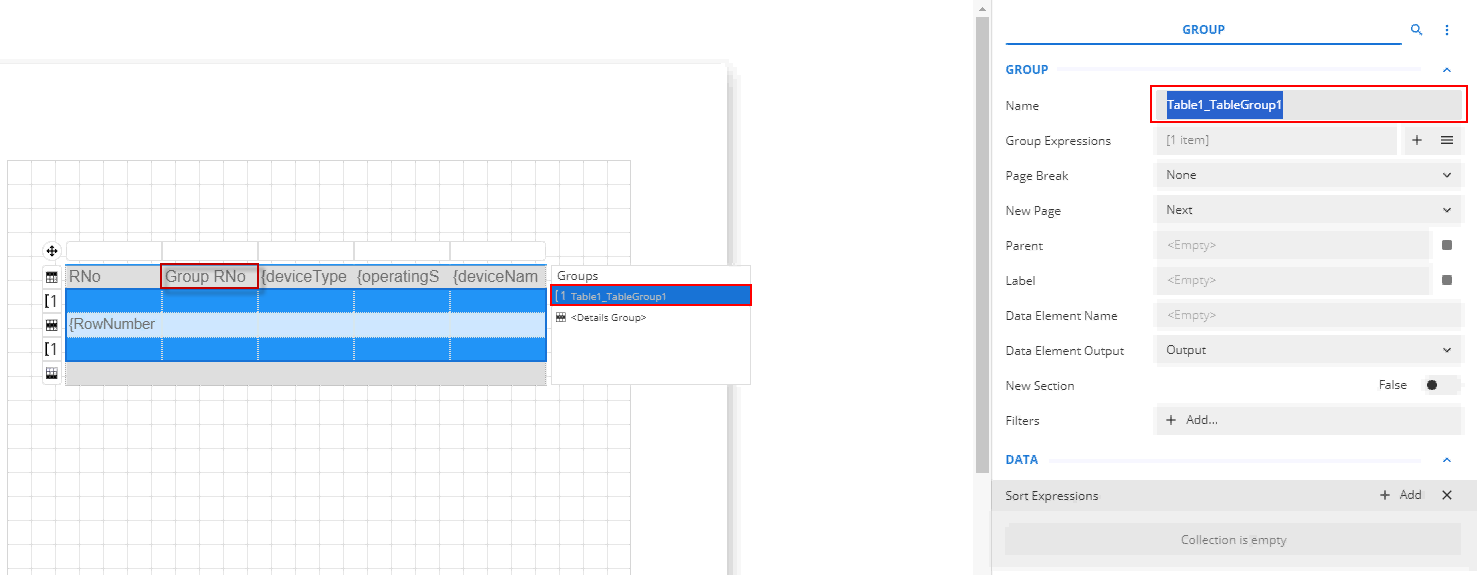
- Right-click the detail cell of the new column and choose the Cell Expression option from the context menu.
- In the Expression Editor that opens, double-click the RowNumber (Scope) property under Common Functions > Miscellaneous on the left, and paste the group name enclosed with double quotes as shown.
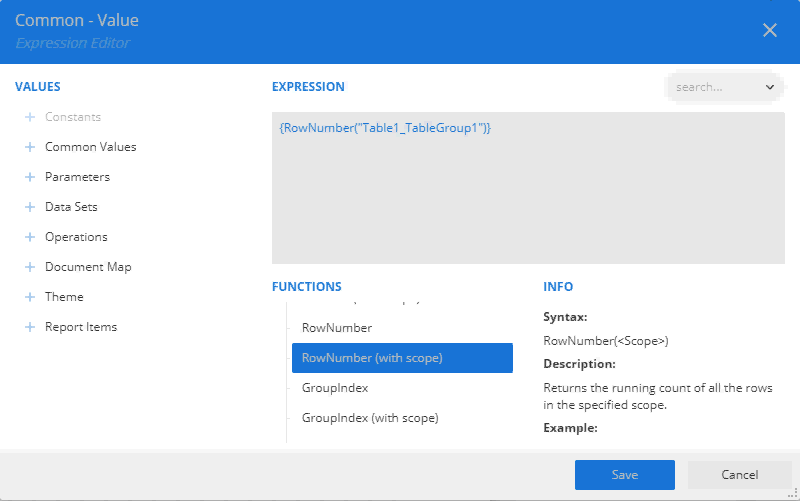
- Click Save and preview the report.


